
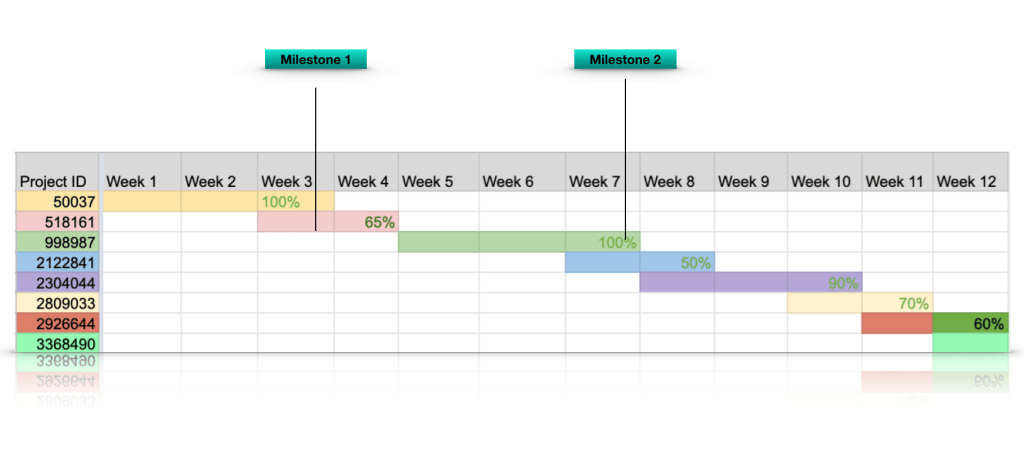
The Gantt Chart is simply a breakdown illustration of project schedule. It was named after Henry Grant, American mechanical engineer and management consultant who invented this chart in 1910s. A Gantt diagram represents the project or tasks in the horizontal bar chart form. This cascading format with the various project activities listed helps project managers to track the tasks against their scheduled time and predefined milestones. The Gantt chart could also be considered as a scrum artifact as the burndown chart is used by many teams to communicate and track progress towards the sprint goal.
What to consider when making a Gantt chart
- What are the major deliverables?
- Who is on the team and what role will they play in those deliverables?
- Identify the stakeholders?
- What is the project plan to get to those deliverables and deadline?
- What are the milestones?
- Are there road blockers that could impact the timeline?
